
The crowd memory report
What players
remember.
Every finished pile leaves a map of gaming memory: the reflex answers, the eras that dominate, and the places where recall slows down. These figures come from real, completed Name 100 Games runs—not surveys or generated articles.
3,427
qualifying completed runs
342,700
verified answers in the sample
17,310
distinct games remembered
Sample window Jul 13, 2026–Oct 15, 2026 · updated from the latest qualifying run
Enter the collective memory mapSee which games people recall together01 · The memory shelf
The games that refuse to be forgotten
Ranked by the share of qualifying runs containing each title. A game can appear only once per run, so this measures piles containing the game—not raw repetitions.
- #1
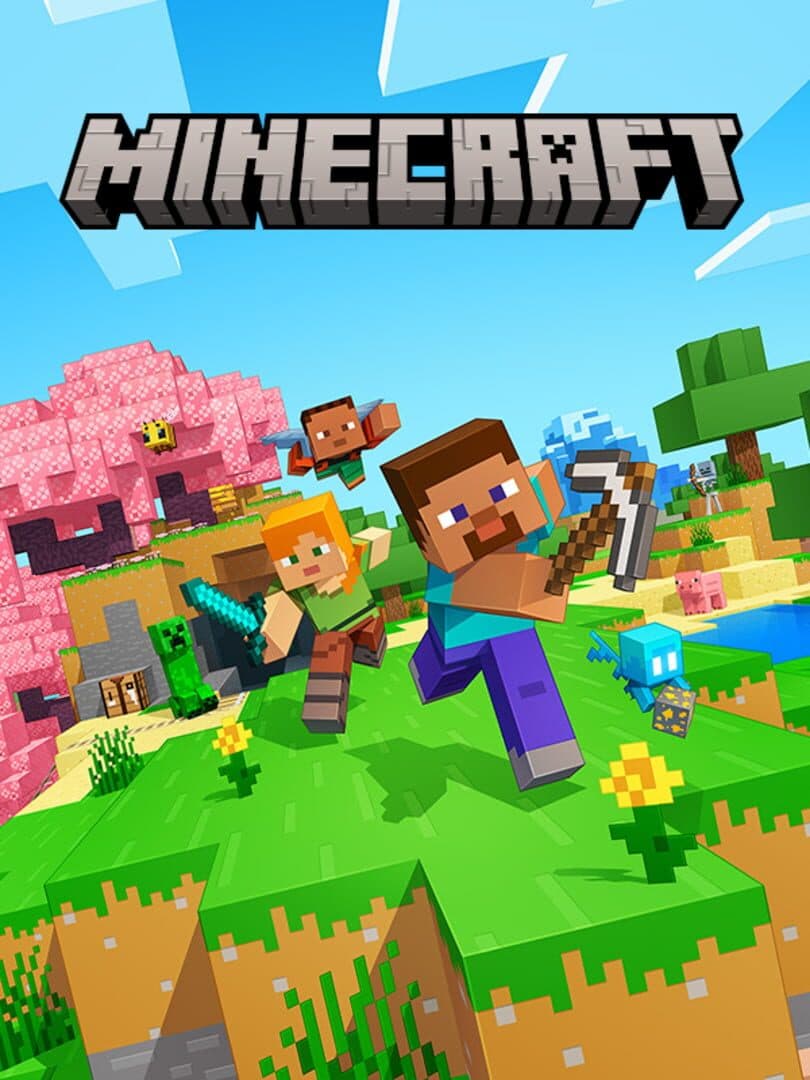
Minecraft
65.1% of runs
- #2
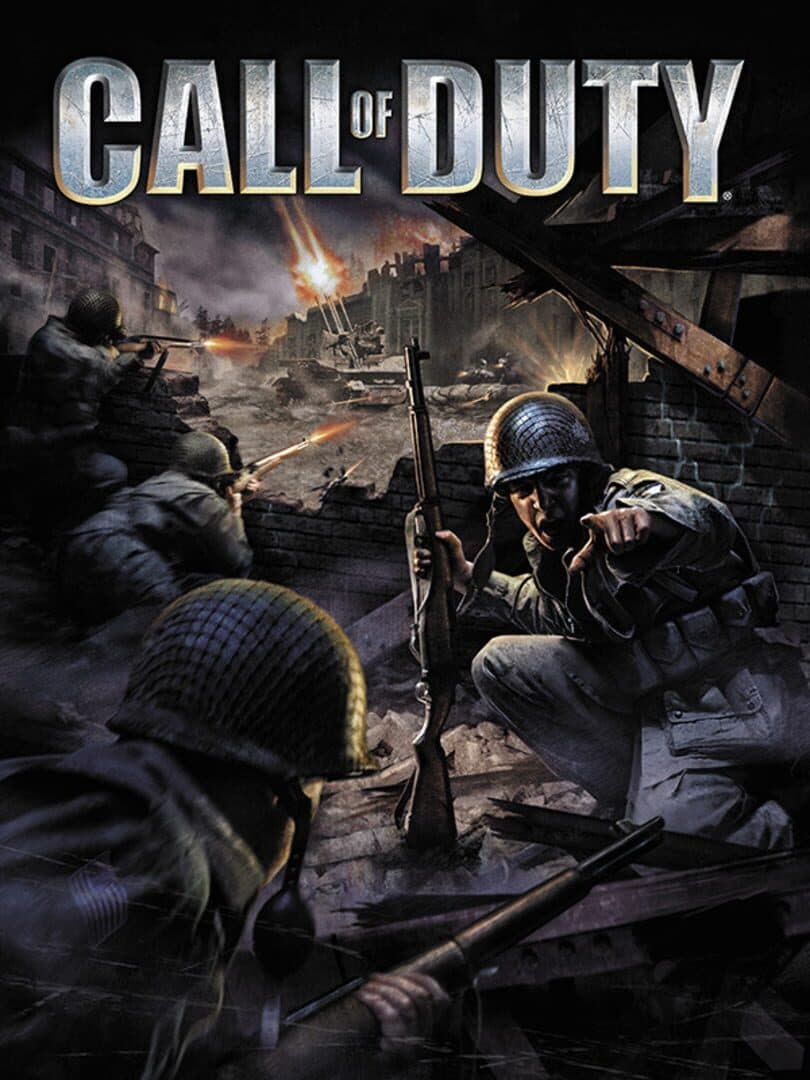
Call of Duty
53.0% of runs
- #3

Fortnite
45.9% of runs
- #4

League of Legends
44.5% of runs
- #5
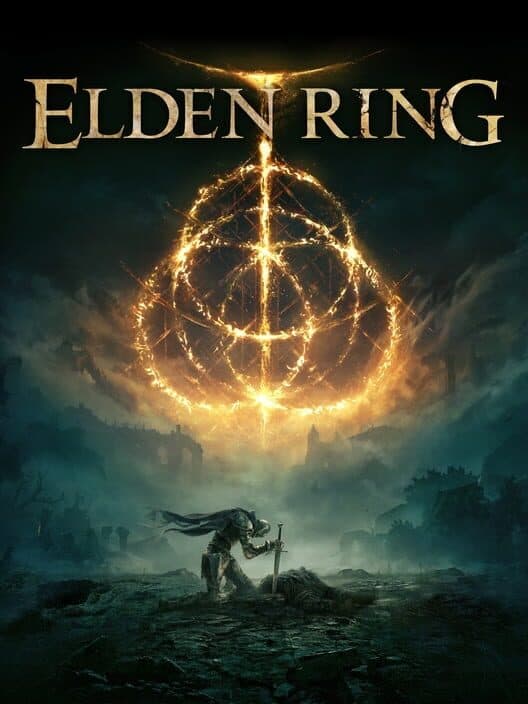
ELDEN RING
39.5% of runs
- #6
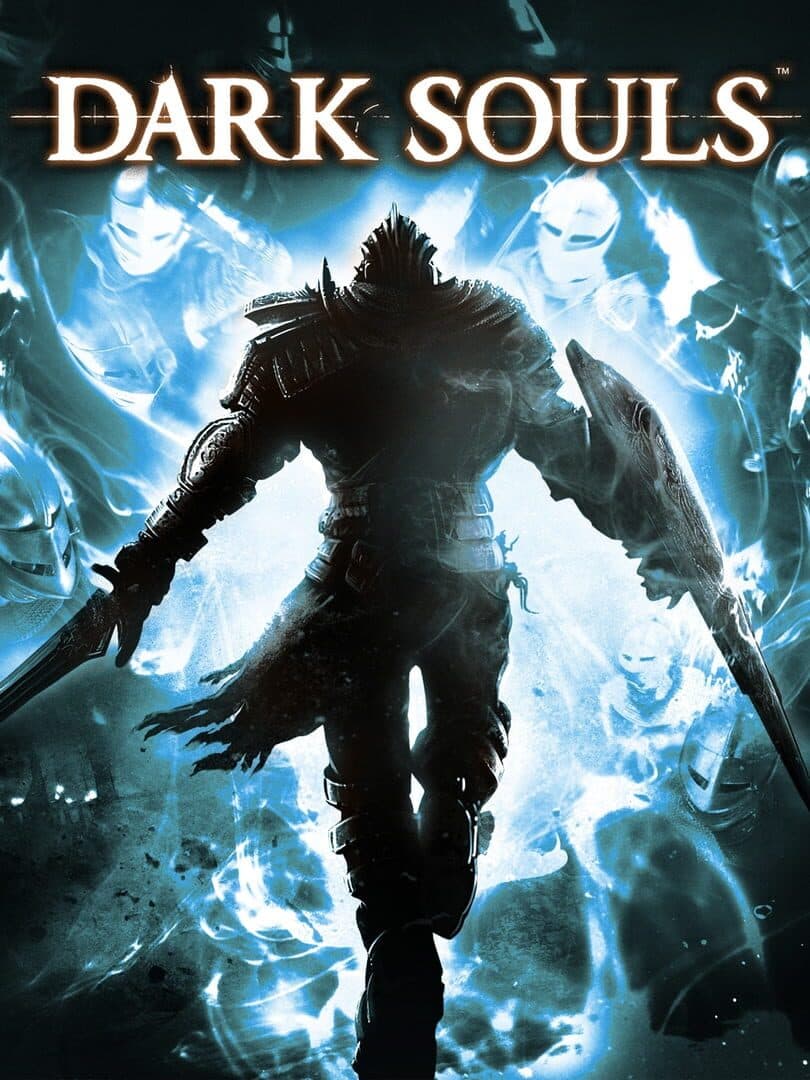
Dark Souls
39.4% of runs
- #7
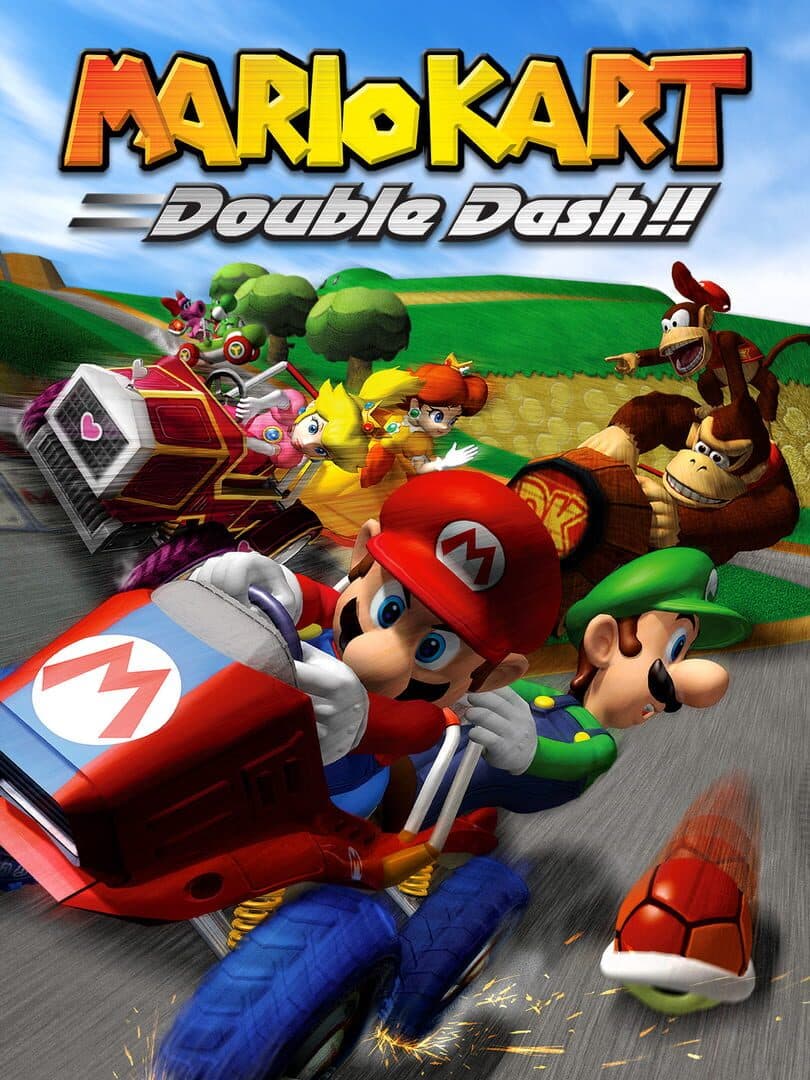
Mario Kart: Double Dash!!
38.6% of runs
- #8
Overwatch®
36.5% of runs
- #9
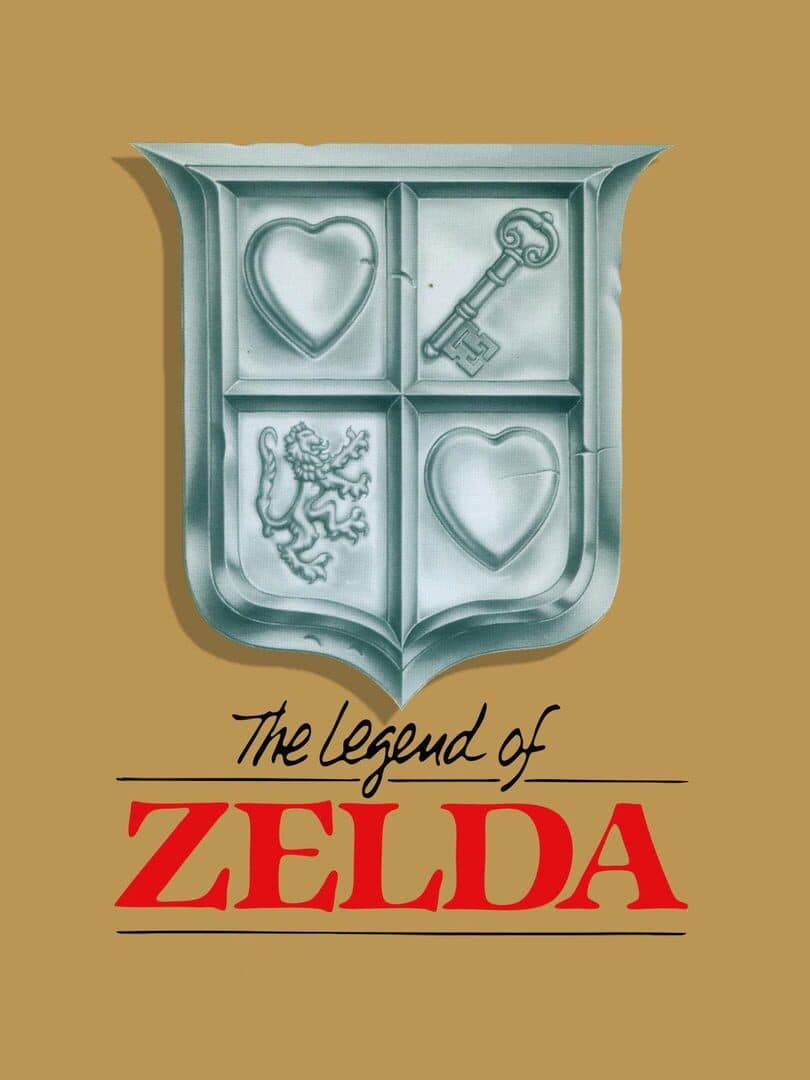
The Legend of Zelda
36.4% of runs
- #10
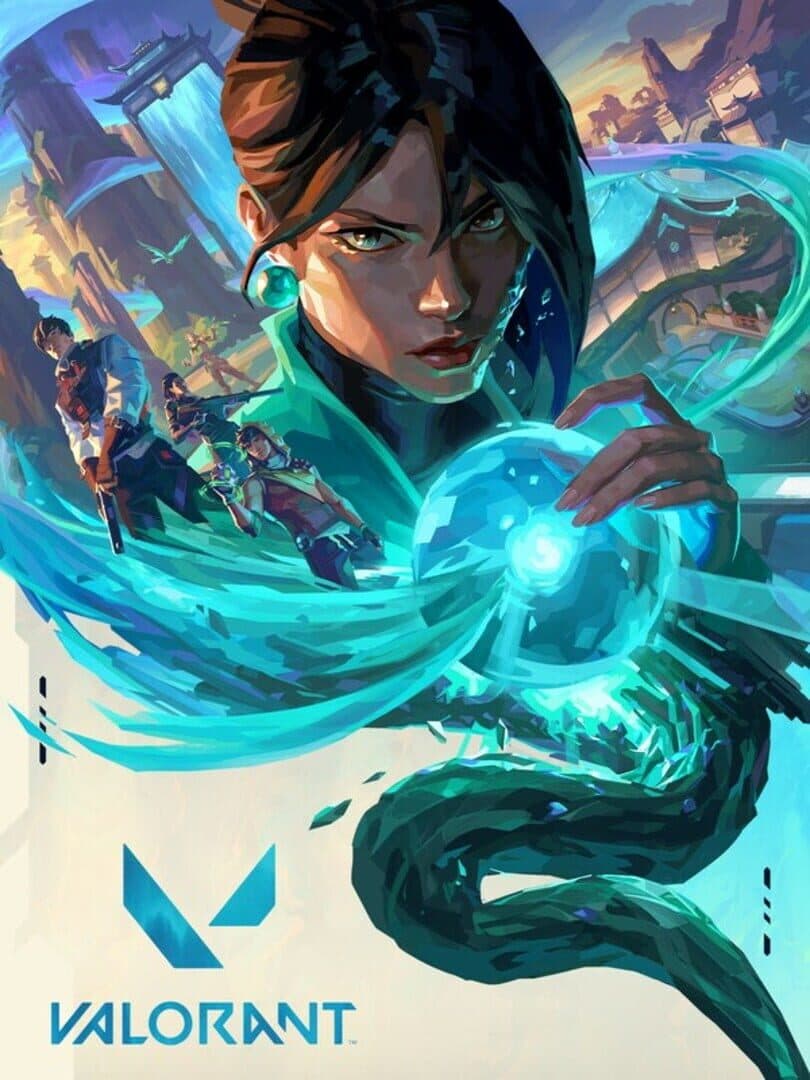
Valorant
35.9% of runs
- #11

Super Mario Bros
35.5% of runs
- #12
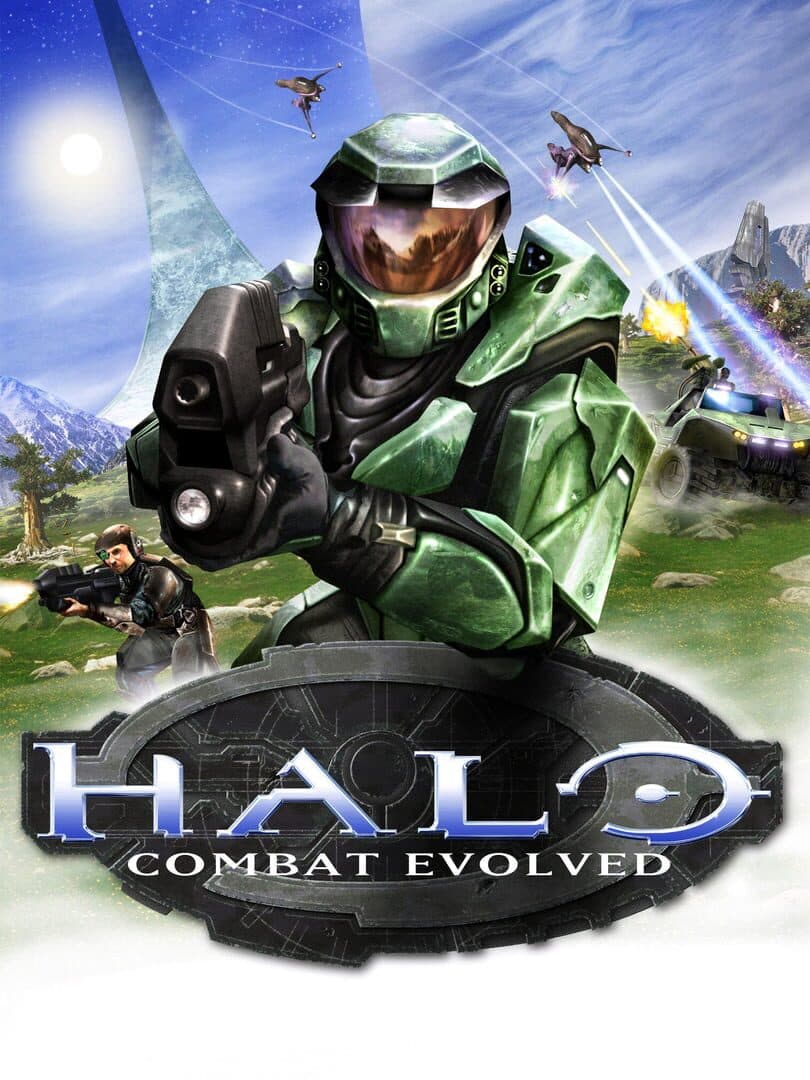
Halo: Combat Evolved
35.2% of runs
02 · The starting grid
Which game lands first?
Openers reveal the titles closest to the surface before strategy, series runs, and memory detours take over.
- 110.7%
Minecraft
Opens 368 runs
- 24.3%
Super Mario Bros
Opens 147 runs
- 33.8%
Fortnite
Opens 129 runs
- 42.9%
Halo: Combat Evolved
Opens 99 runs
- 5
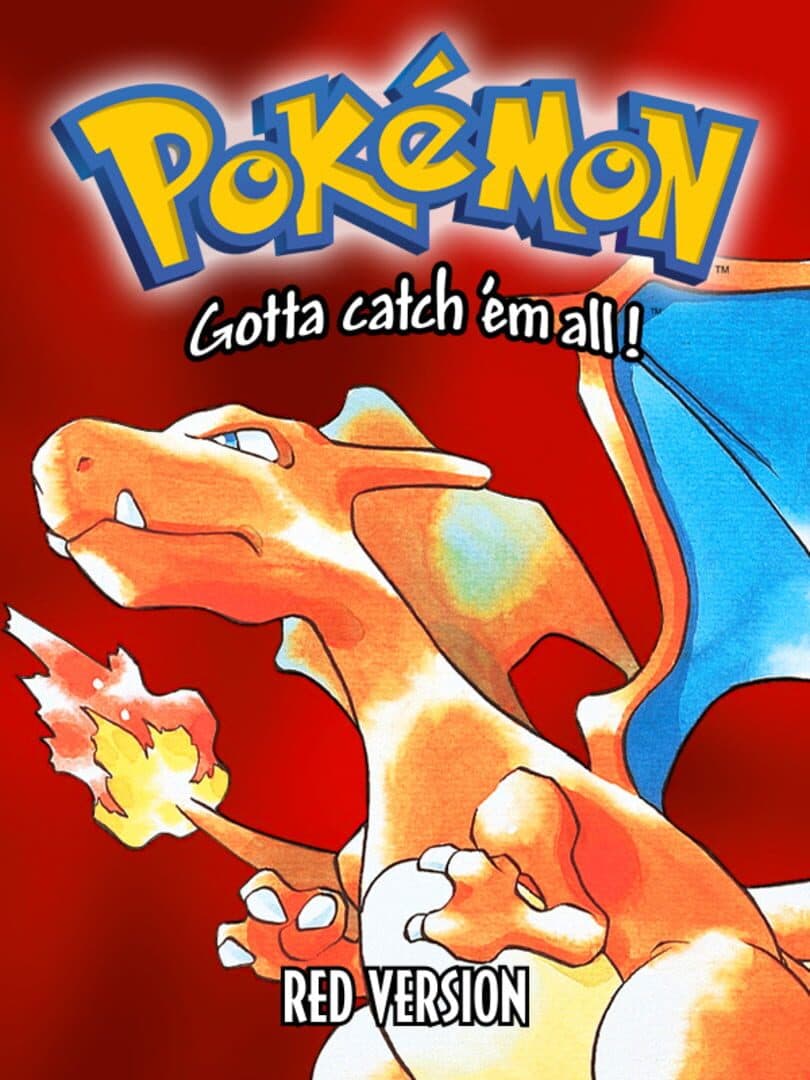 2.2%
2.2%Pokémon Red Version
Opens 74 runs
- 61.9%
Call of Duty
Opens 64 runs
- 7
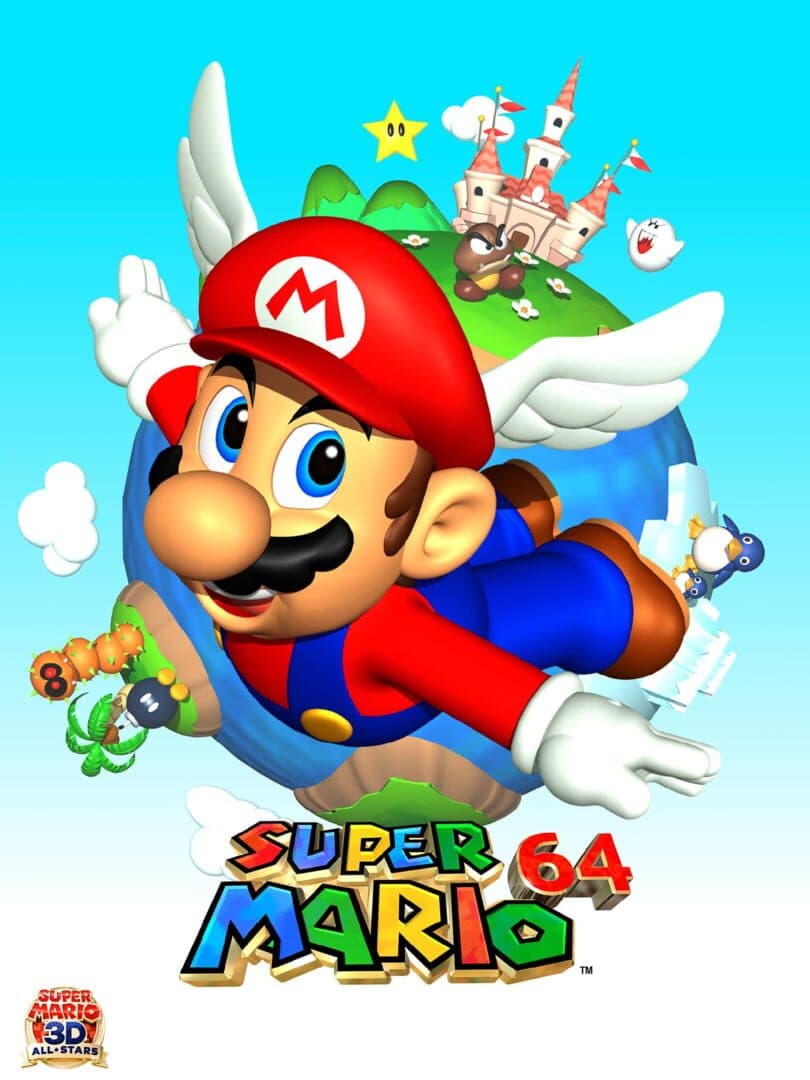 1.8%
1.8%Super Mario 64
Opens 61 runs
- 81.8%
League of Legends
Opens 60 runs
03 · The hundred-step climb
Recall gets heavier near the top
Each step is ten games at the median pace, so the staircase is the typical run. The haze on a step is its longest single pause.
- Games 1–10: 0:47, longest pause 0:11, reached at 0:47.
- Games 11–20: 0:49, longest pause 0:12, reached at 1:39.
- Games 21–30: 0:51, longest pause 0:12, reached at 2:33.
- Games 31–40: 0:53, longest pause 0:13, reached at 3:30.
- Games 41–50: 0:55, longest pause 0:14, reached at 4:31.
- Games 51–60: 0:57, longest pause 0:14, reached at 5:32.
- Games 61–70: 0:58, longest pause 0:15, reached at 6:32.
- Games 71–80: 0:59, longest pause 0:15, reached at 7:35.
- Games 81–90: 1:01, longest pause 0:16, reached at 8:39.
- Games 91–100: 1:02, longest pause 0:16, reached at 9:46.
04 · The arcade timeline
The eras inside the pile
Every answer with a known release year, stacked by decade. Release metadata covers 68.3% of all answers in this sample.
- 1970s: 0.2% of dated answers1970s
- 1980s: 1.7% of dated answers1980s
- 1990s: 6.9% of dated answers1990s
- 2000s: 19.8% of dated answers2000s
- 2010s: 41.7% of dated answers2010s
- 2020s: 29.6% of dated answers2020s
05 · The recurring deep-cut crate
Rare, but not a one‑off
Each of these turned up in about one run in a hundred: rare enough to surprise, but never just once.
Garfield Kart - Furious Racing
34 runs · 1.0%
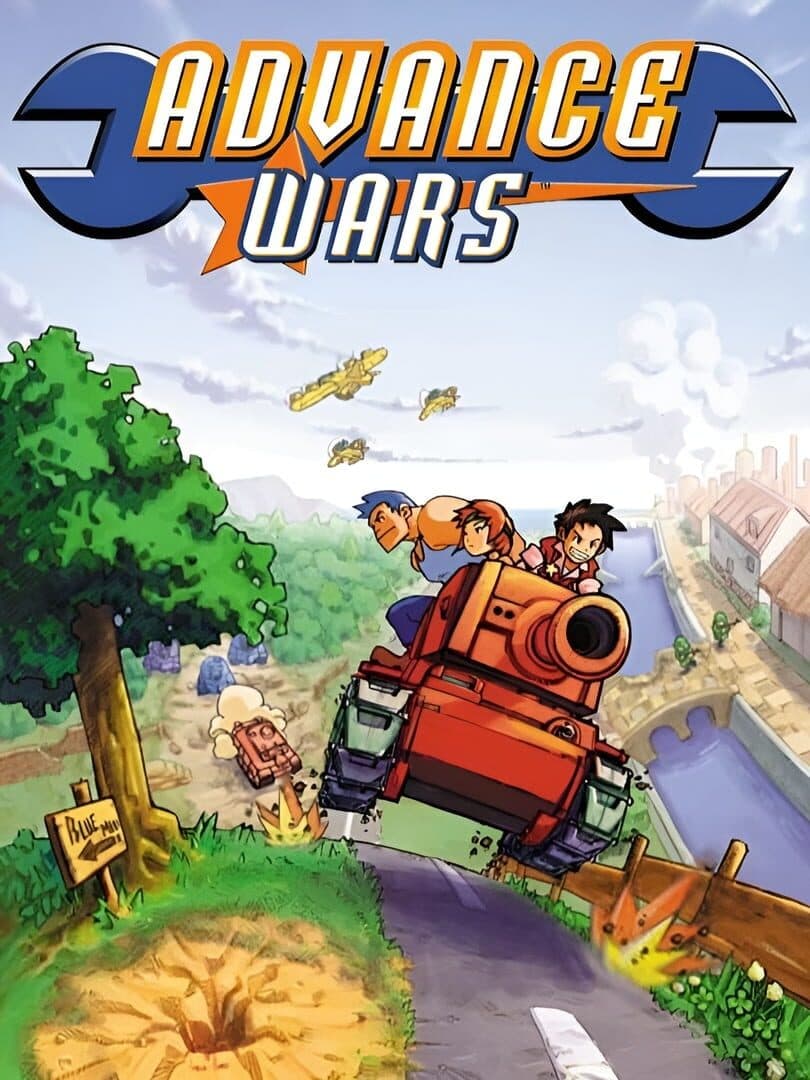
Advance Wars
34 runs · 1.0%
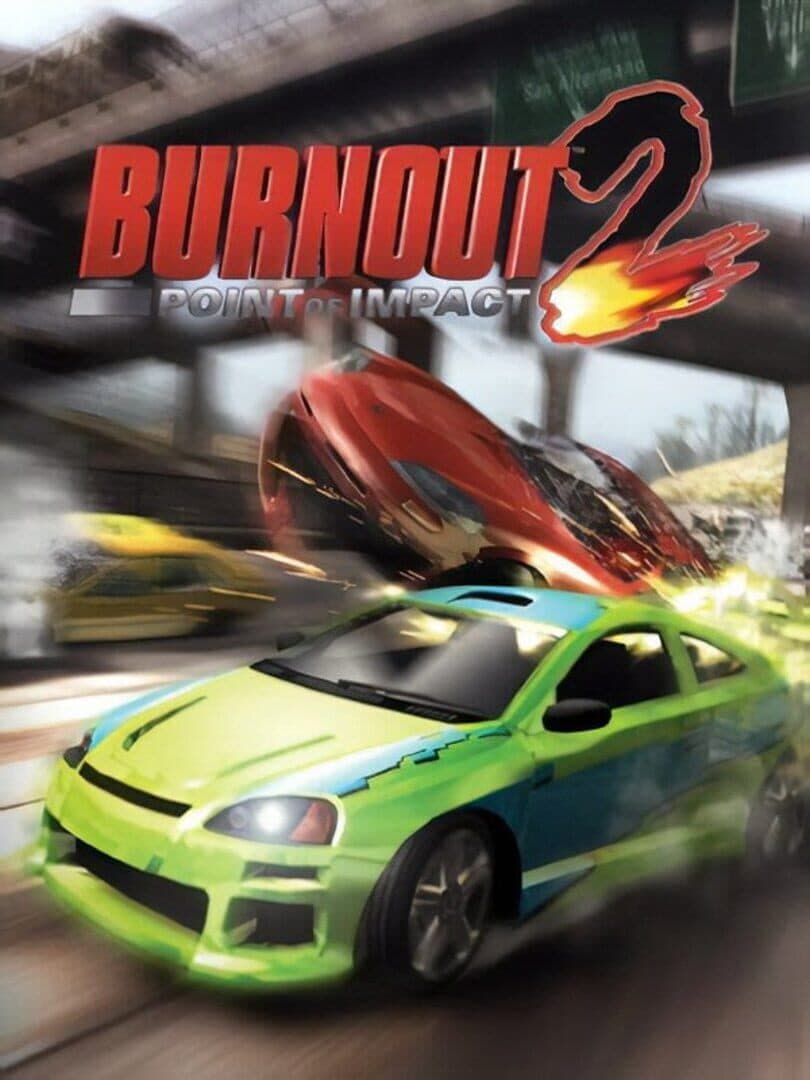
Burnout 2: Point of Impact
34 runs · 1.0%

Connect 4
34 runs · 1.0%
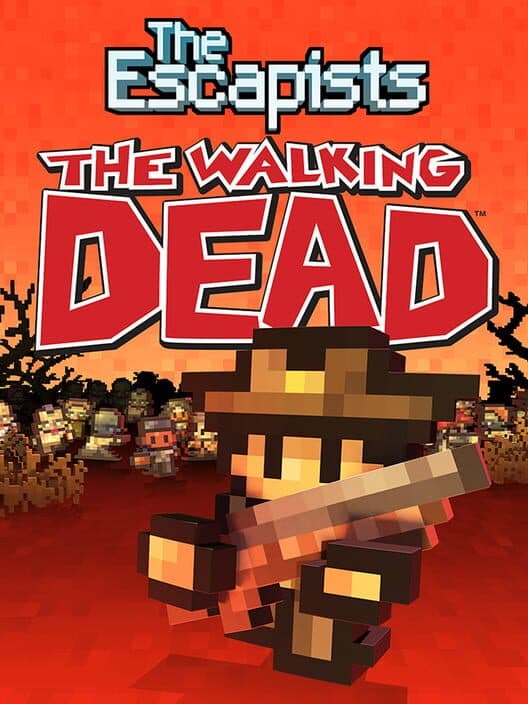
The Escapists: The Walking Dead
34 runs · 1.0%

Fields of Mistria
34 runs · 1.0%
Bongo Cat
34 runs · 1.0%
Metro 2033
34 runs · 1.0%
ONE PIECE ODYSSEY
34 runs · 1.0%
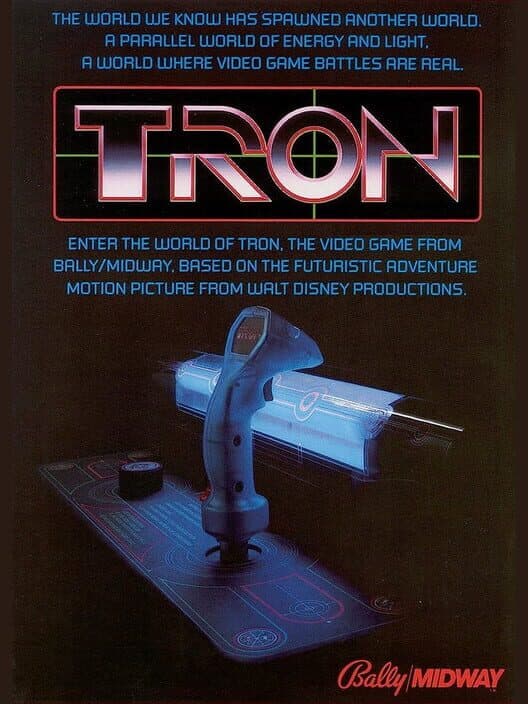
Tron
34 runs · 1.0%
The Invincible
34 runs · 1.0%
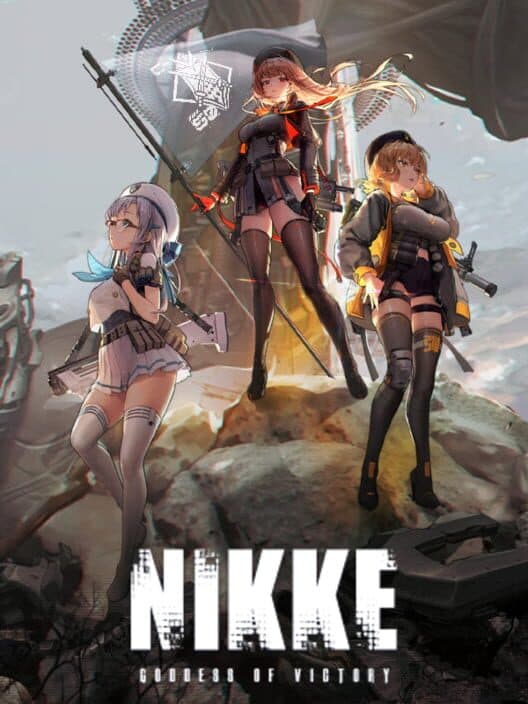
Goddess of Victory: Nikke
34 runs · 1.0%
How original is a pile?
The median completed run has an average title overlap of 10.8%. The most original 10% average 7.6% or less.
Methodology
We scan at most the latest 5,000 candidate standard SOLO/100 runs under the current rules version; 3,427 qualified for this report. A qualifying run must contain exactly 100 distinct normalized game titles with ordered timestamps and a duration between ten seconds and 24 hours. Internal test users, Daily, Live, Twitch, Ultra, Perma Death, incomplete, malformed, and exact duplicate timelines are excluded.
A “run” is not necessarily a unique person: 3,083 sample runs were guests and 344 belonged to accounts, while repeat attempts can remain in either group. Frequencies therefore describe completed runs, not the percentage of all players who remember a game.
Each climb step is the median time for that ten-game stretch. Its haze first takes each run’s longest single pause within the stretch, then uses the median of those maxima, so one abandoned browser tab cannot dominate the result. A deep cut must appear in at least two runs and at most 1% of them. Release-era percentages use only answers with a known year; failed optional metadata lookups never remove a game from any other count. No rejected speech text or audio is used here.
Game rankings are cover-driven: current catalog artwork is used to fill older run metadata, and titles still lacking a cover are omitted from visual ranking slots. Those titles remain in the aggregate run, answer, uniqueness, timing, and era denominators.
Sample begins
Jul 13, 2026
Last updated
Oct 15, 2026
Dated answers
234,157 · 68.3%
Your memory, on the clock